Create individual analytical data reports
Rather than creating a report for the entire library, Weblog Expert enables you to create a custom group of tables for individual operational or business units in an organisation. The output will create a document and file table for each operational unit under a group; in this guide the group is labelled Custom. The configuration requires the url and folder structures of the documents store and mapstore to be unique and also to reflect the business units in the process library. It is necessary to apply appropriate filters to the main profile to exclude library site objects and files. Also filters are applied to each individual business unit’s tables as a mechanism to identify and report the business unit’s data.
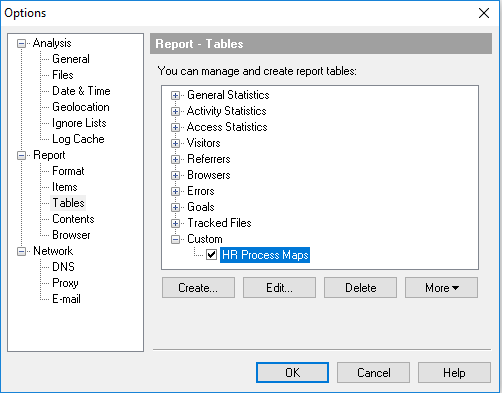
Log on to the server, double click the Weblog Expert icon
![]() to launch the console.
to launch the console.
Highlight the profile you want to receive the analytical data and filtered reports from.
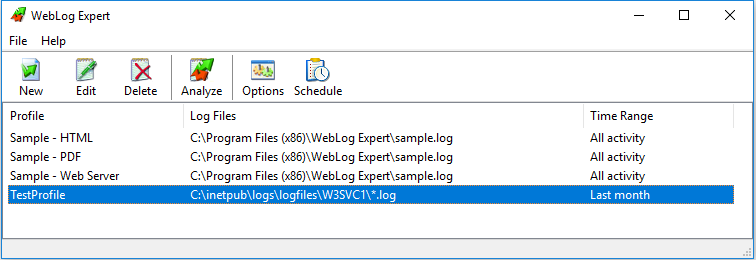
Click Options then under Report select Tables on the left pane then click to highlight Custom.
NOTE: if you have not created any custom reports previously, you will not see the custom menu option. Click on the create option as per the image below.
Create Custom Reports
Click Options then under Report select Tables on the left pane.
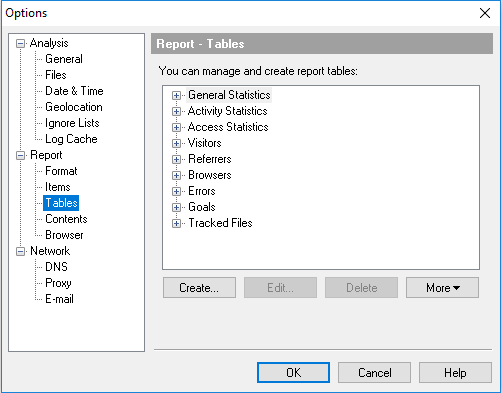
Click Create….
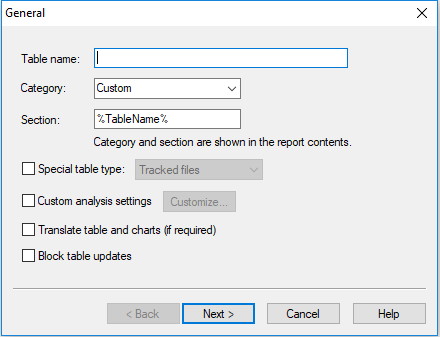
In Table name, type the name of the operational unit. This will will be the bar and table header/title, for example HR Process Maps or HR Documents.
Leave Category: as Custom.
Under Section:, type in the operational unit title as you want it to appear in the report.
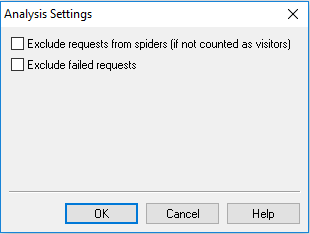
Tick Custom analysis settings and click Customize… to open the Analysis Settings window and select both options. Click OK to close.
In the Options Report Tables Create window, select Translate table and charts (if required) then click Next to open the Data window.
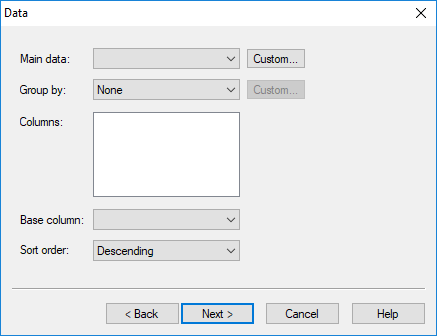
In Main data, select the data type you want from the drop down list, in this example it is File name. This will also populate the Columns box.
Leave the Group By as None.
Under Columns select the data columns you want in the table for example Hits, Incomplete Requests, Page Views and Visitors.
The Base column consists of the selections ticked above. Select the option you want to use on the X and Y axis of the graphical outputs for example Y-axis Hits against X-axis Time.
Next select the order that the data will be displayed in the table e.g. ascending or descending.
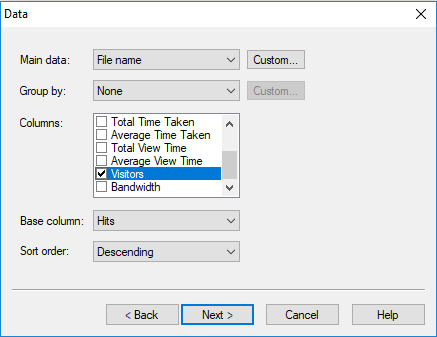
The following example shows how you can isolate one library and site into an individual report. The same could be done for folders/departments within a site of a library.
Click Next to display the Filters window. This uses the same mechanisms as for the Profile Filters.
Under filter set up the following:
| Filter Type | Filter Criteria | Text to be input |
|---|---|---|
| Exclude | File | /processlibraries*2011/IS/live/document*html/* |
| Exclude | File | /processlibraries*2011/IS/live/static*html/* |
| Include | File | /processlibraries*2011/IS/* |
Note: IS represents the operational unit. Change as appropriate.
Click Next to view the Charts.
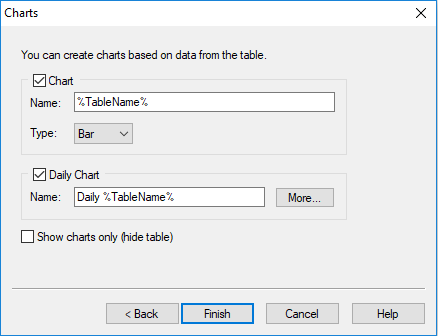
Select Chart and provide the name of the chart header as it will appear in the report. Similarly do the same with Daily chart in addition select More… to specify the names of the weekly, monthly and yearly charts.
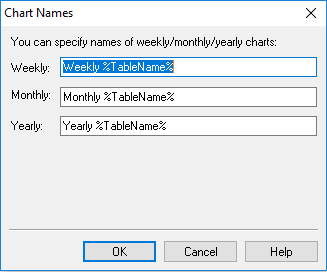
Click OK, then Finish.
The Options Report Table window will now include a Custom item with the name of the table input above.
